rm(list=ls())  #remove all variables in the R environment
library(TAM)  #load the package TAM so we can use the functions in TAM
library(tidyverse)

# load in the dataset
responses <- read_csv('data/responses.csv')
# keep the scores
responses <- responses %>% select(ends_with('score'))
mod1 <- tam.jml(responses,bias=FALSE)19 Infit & Outfit
19.1 Model based residuals
While it is most informative to consider each ICC indiviudally, the fit of the predicted ICC to the empirical ICC can be summarised using the residual-based fit statistics. These are the Infit and Outfit statistics.
Read through this article on residual based statistics and then answer the questions below: http://www.edmeasurementsurveys.com/IRT/residual-based-item-fit-statistics.html
If the probability for a person getting an item correct is 0.8 and the person gets it wrong, what is the model residual?
Why do we need to standardise residuals? Consider which items lend themselves to generating the highest residuals.
What is the difference between infit and outfit?
19.2 Obtaining infit and outfit statistics from TAM
fit1 <- tam.jml.fit(mod1,trim_val = NULL)

item_fit <- tibble(fit1$fit.item)
item_fit <- item_fit %>% bind_cols(mod1$item1)

# plot the item infit against the item difficulty
p <- ggplot(item_fit, aes(x=infitItem, y=xsi, size=se.xsi,label=item))
p <- p + geom_point()
p <- p + geom_text(data=item_fit %>% filter(infitItem>1.1),aes(x=infitItem, y=xsi,label=item,size=4),nudge_y=0.15, nudge_x = -0.005)
print(p)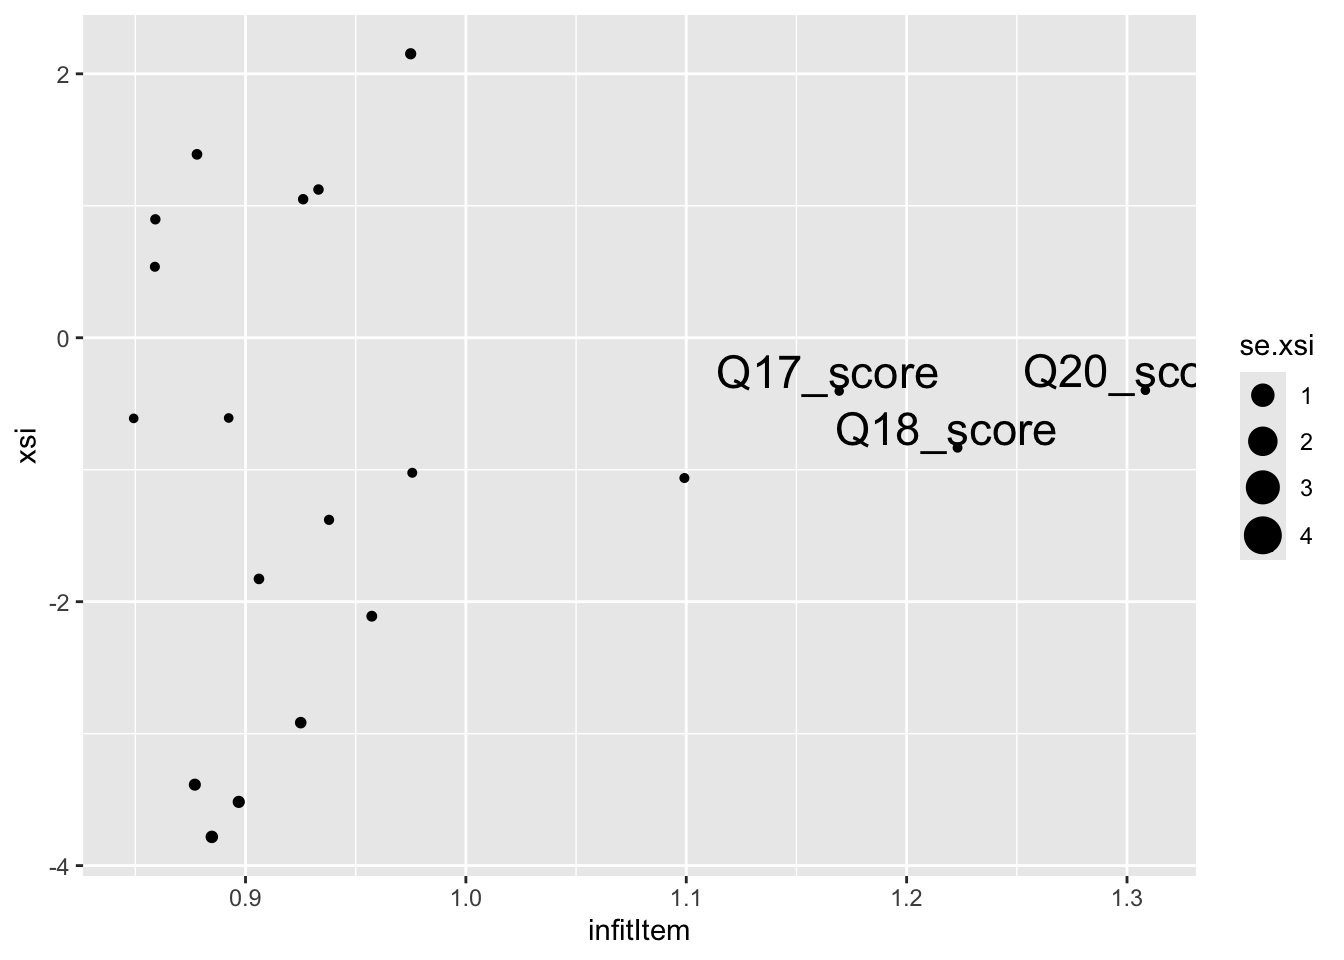
19.3 How does the fit of the items reflect the visual differences seen in the ICCs?
The residual-based fit statistics reflect the slope of the ICC:
When fit MS is close to 1, the item has average item discrimination of the set of items.
When fit MS is lower than 1, the item is more discriminating than the average item discrimination.
When fit MS is higher than 1, the item is less discriminating than the average item discrimination.
19.4 Identify an item of each type and plot the ICC using dexter or TAM or both
knitr::kable(item_fit)| item | outfitItem | outfitItem_t | infitItem | infitItem_t | xsi.label | xsi.index | xsi | se.xsi |
|---|---|---|---|---|---|---|---|---|
| Q1_score | 0.9797235 | 0.0189696 | 0.8847164 | -1.698166 | Q1_score | 1 | -3.7821492 | 0.0882013 |
| Q2_score | 0.6525936 | -1.6708322 | 0.8770009 | -2.235203 | Q2_score | 2 | -3.3864840 | 0.0764413 |
| Q3_score | 0.9838805 | -0.2153473 | 0.9756750 | -1.296906 | Q3_score | 3 | -1.0231322 | 0.0441238 |
| Q4_score | 0.8110495 | -0.7529440 | 0.8969344 | -1.736044 | Q4_score | 4 | -3.5170835 | 0.0799253 |
| Q5_score | 0.8010940 | -1.1346164 | 0.9250514 | -1.701892 | Q5_score | 5 | -2.9166533 | 0.0653987 |
| Q6_score | 0.8319356 | -3.8339818 | 0.8588723 | -7.086654 | Q6_score | 6 | 0.5379798 | 0.0445907 |
| Q7_score | 1.1635038 | 2.9172906 | 0.9261510 | -3.022372 | Q7_score | 7 | 1.0498226 | 0.0475477 |
| Q8_score | 1.0508241 | 0.9961172 | 0.8590920 | -6.247703 | Q8_score | 8 | 0.8974539 | 0.0465478 |
| Q9_score | 0.7799628 | -4.2196883 | 0.8492577 | -9.130254 | Q9_score | 9 | -0.6110642 | 0.0429607 |
| Q10_score | 0.8958307 | -1.0189656 | 0.9061027 | -3.723771 | Q10_score | 10 | -1.8274175 | 0.0495896 |
| Q11_score | 0.9065434 | -0.7731752 | 0.9572990 | -1.443723 | Q11_score | 11 | -2.1099719 | 0.0526539 |
| Q12_score | 0.8456285 | -2.8842673 | 0.8923705 | -6.416305 | Q12_score | 12 | -0.6079783 | 0.0429789 |
| Q13_score | 1.3080644 | 4.0559114 | 1.0991629 | 5.044595 | Q13_score | 13 | -1.0628414 | 0.0443793 |
| Q14_score | 0.9379332 | -0.7508216 | 0.9378989 | -2.972885 | Q14_score | 14 | -1.3797714 | 0.0460026 |
| Q15_score | 1.8889519 | 7.7623556 | 0.9749421 | -0.670220 | Q15_score | 15 | 2.1519502 | 0.0583749 |
| Q16_score | 1.1611823 | 2.7923840 | 0.9331116 | -2.659089 | Q16_score | 16 | 1.1233204 | 0.0480441 |
| Q17_score | 1.2597740 | 4.6460664 | 1.1694071 | 9.295411 | Q17_score | 17 | -0.4042228 | 0.0427812 |
| Q18_score | 1.4944567 | 6.9113090 | 1.2231038 | 11.557121 | Q18_score | 18 | -0.8334649 | 0.0436284 |
| Q19_score | 1.2003466 | 3.0241588 | 0.8779823 | -4.493908 | Q19_score | 19 | 1.3899447 | 0.0502289 |
| Q20_score | 1.4679481 | 7.9330061 | 1.3083348 | 16.238924 | Q20_score | 20 | -0.3980148 | 0.0428142 |