rm(list=ls())
library(tidyverse)
library(dexter)
# load in the dataset
responses <- read_csv('data/responses.csv')
keys <- read_csv('data/key.csv')
# Create the rules
rules <- keys_to_rules(keys, include_NA_rule = TRUE)
db <- start_new_project(rules, db_name = ":memory:", person_properties=list(gender="unknown"))
add_booklet(db, responses, "y7") 10 Distractor analysis with dexter
Dexter is an R package for managing and analyzing data from educational tests and other projects involving individual assessment. https://dexter-psychometrics.github.io/dexter/
10.1 What does it do?
- Easily create a data base tailored to the specific structure of test data
- Safeguard data integrity through a variety of checks; easily recover from wrong answer keys and other human errors
- Classical test and item analysis
- Assess the fit of the Rasch / partial credit model through comparison against both the observed data and a more flexible model; identify problematic items
- Calibrate the test with either conditional maximum likelihood (CML) or MCMC methods
- Estimate ability with CML or MCMC methods, produce conversion tables, draw plausible values
- Apply a variety of mostly novel methods for DIF analysis, equating pass/fail limits and more.
Dexter fundamentals: https://dexter-psychometrics.github.io/dexter/articles/dexter.html
Dexter blog: https://dexter-psychometrics.github.io/dexter/articles/blog/index.html
get_booklets(db) booklet_id n_items n_persons booklet_max_score
1 y7 20 3061 20head(get_items(db)) item_id
1 Q1
2 Q10
3 Q11
4 Q12
5 Q13
6 Q14get_persons(db) %>%
glimpse()Rows: 3,061
Columns: 2
$ person_id <chr> "dx_0000001", "dx_0000002", "dx_0000003", "dx_0000004", "dx_…
$ gender <chr> "F", "M", "F", "M", "M", "F", "M", "M", "F", "M", "F", "F", …tt = tia_tables(db)
tt$booklets booklet_id n_items alpha mean_pvalue mean_rit mean_rir
1 y7 20 0.8137408 0.599755 0.4681555 0.3826158
max_booklet_score n_persons
1 20 3061knitr::kable(tt$items, digits = 2)| booklet_id | item_id | mean_score | sd_score | max_score | pvalue | rit | rir | n_persons |
|---|---|---|---|---|---|---|---|---|
| y7 | Q1 | 0.95 | 0.23 | 1 | 0.95 | 0.33 | 0.28 | 3061 |
| y7 | Q10 | 0.78 | 0.41 | 1 | 0.78 | 0.49 | 0.41 | 3061 |
| y7 | Q11 | 0.82 | 0.39 | 1 | 0.82 | 0.44 | 0.35 | 3061 |
| y7 | Q12 | 0.59 | 0.49 | 1 | 0.59 | 0.58 | 0.49 | 3061 |
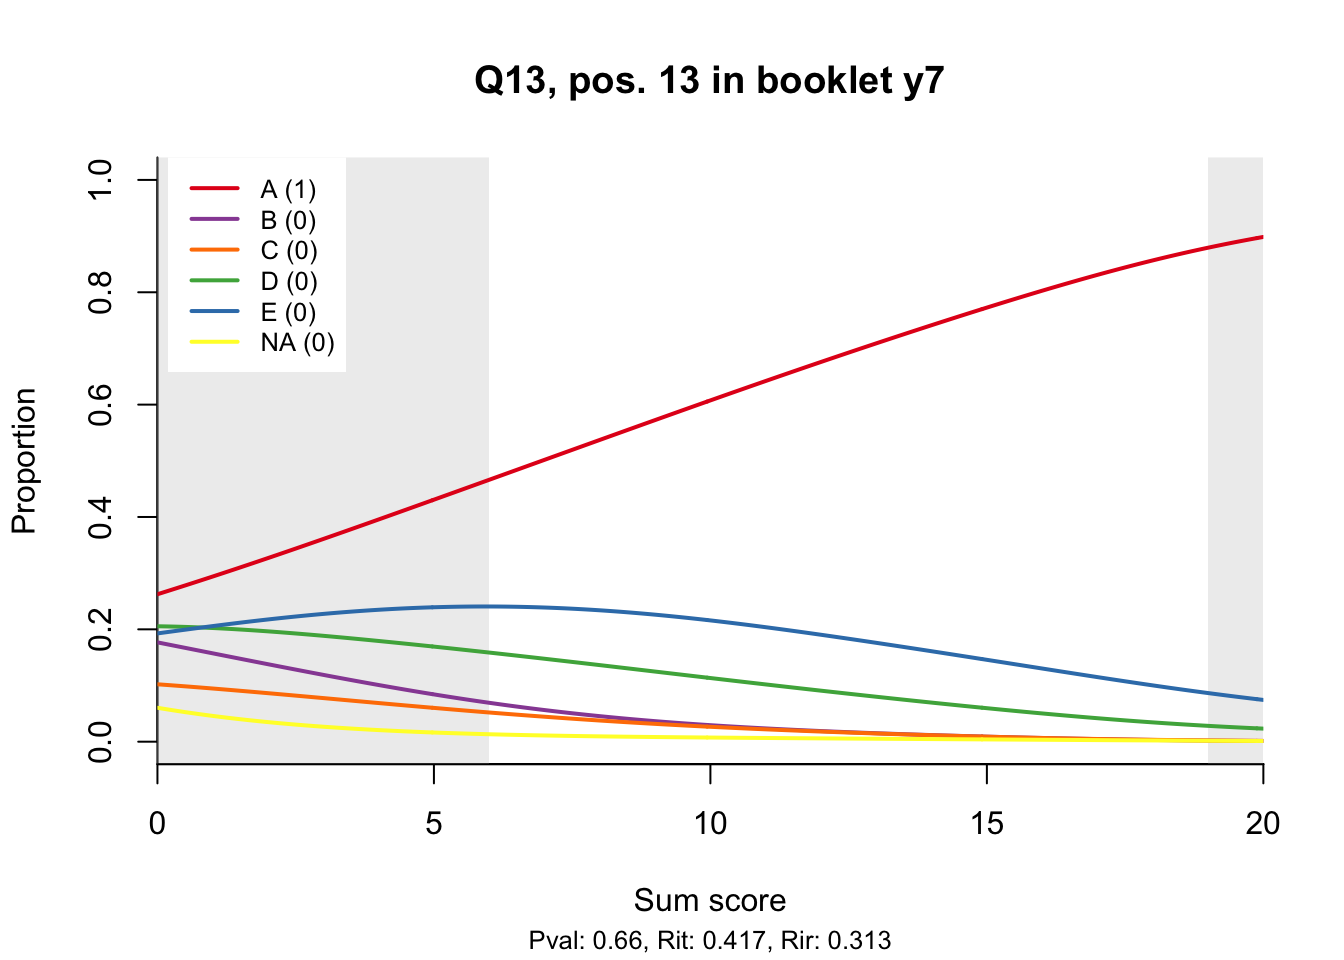
| y7 | Q13 | 0.66 | 0.47 | 1 | 0.66 | 0.42 | 0.31 | 3061 |
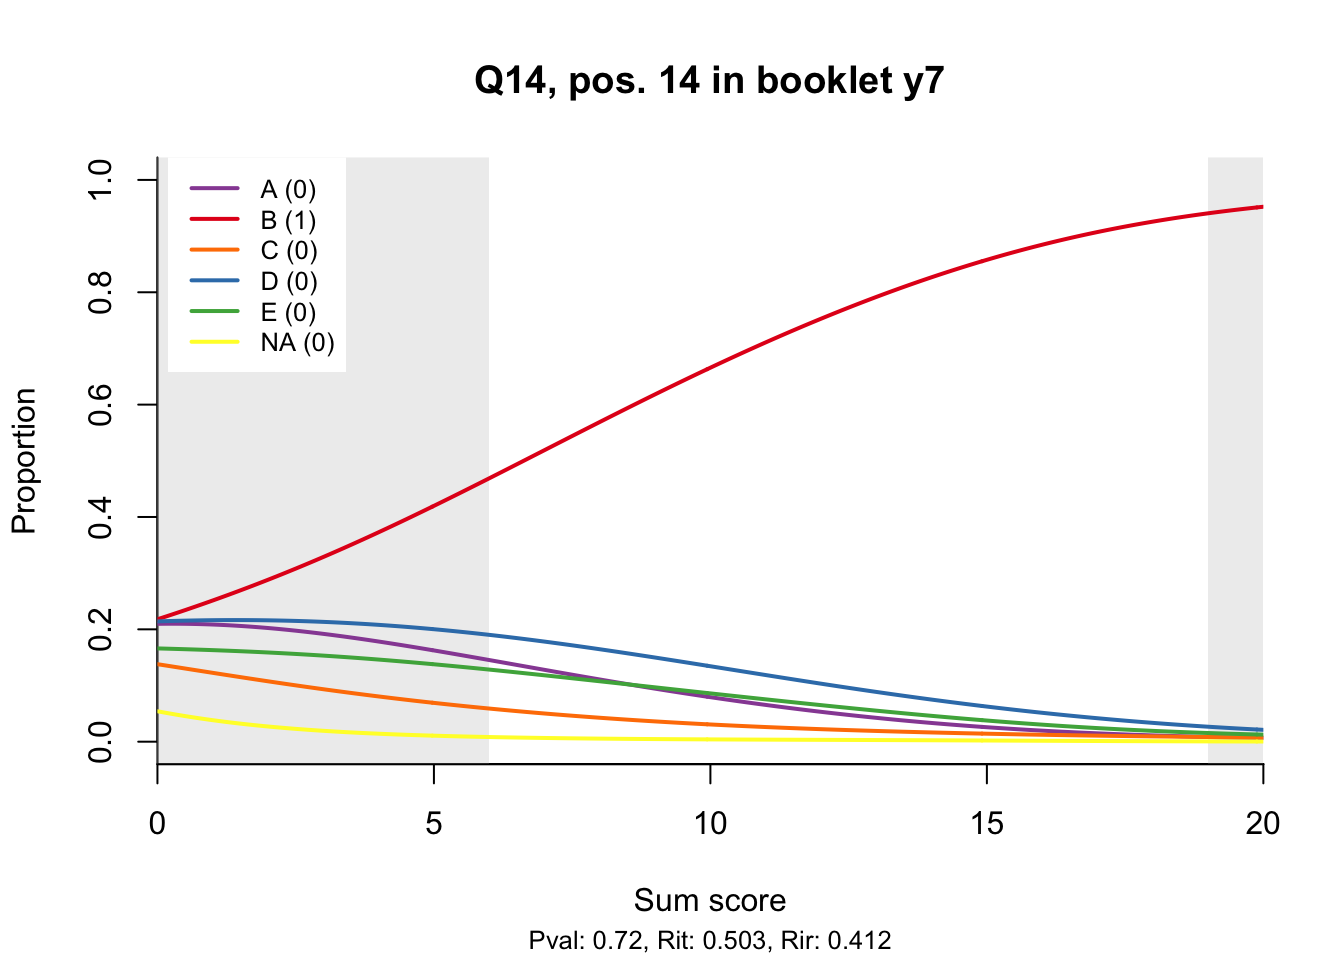
| y7 | Q14 | 0.72 | 0.45 | 1 | 0.72 | 0.50 | 0.41 | 3061 |
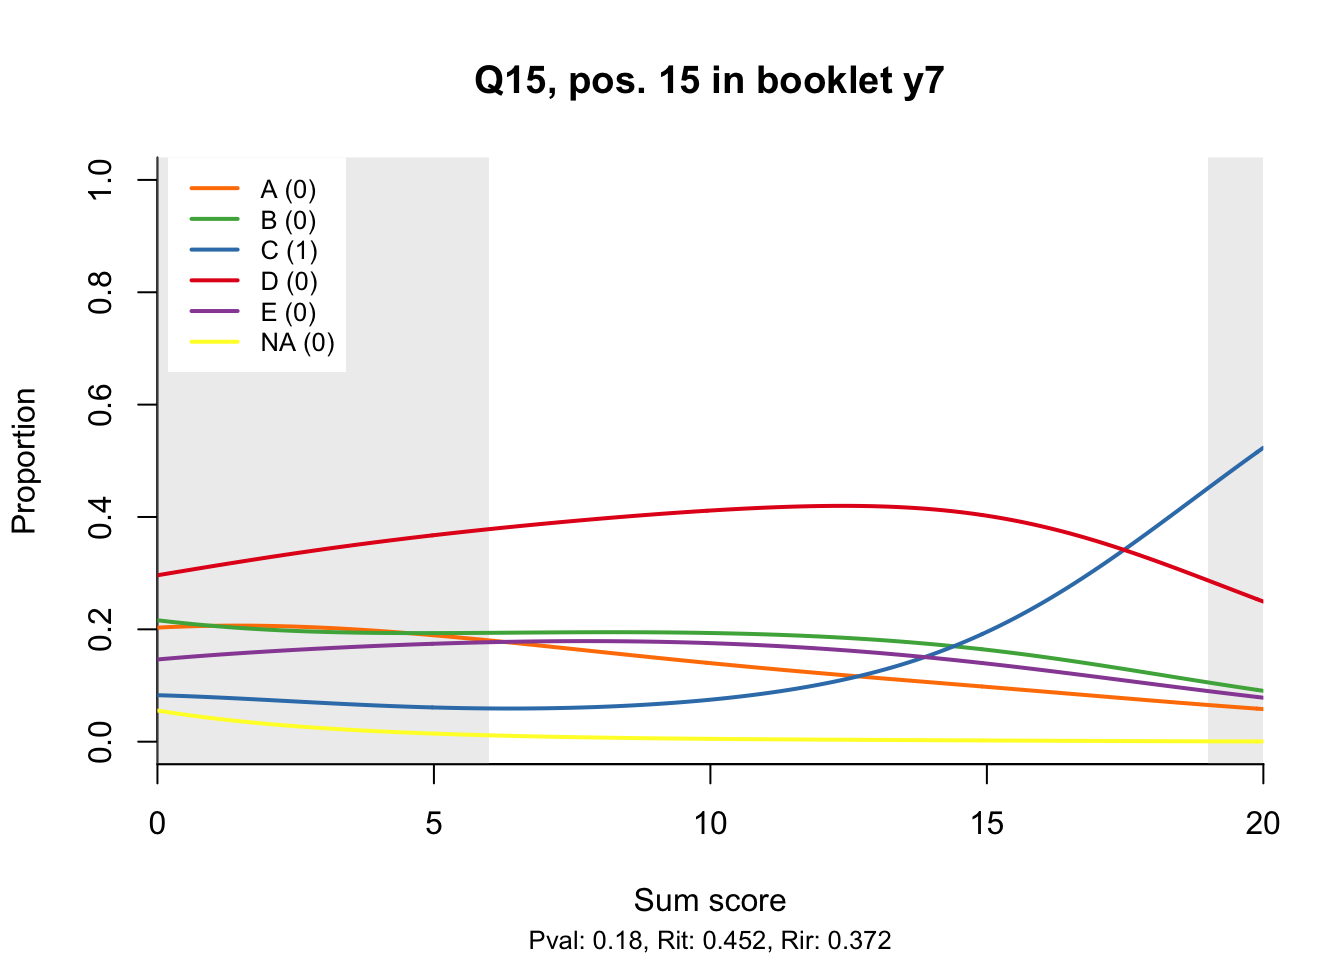
| y7 | Q15 | 0.18 | 0.38 | 1 | 0.18 | 0.45 | 0.37 | 3061 |
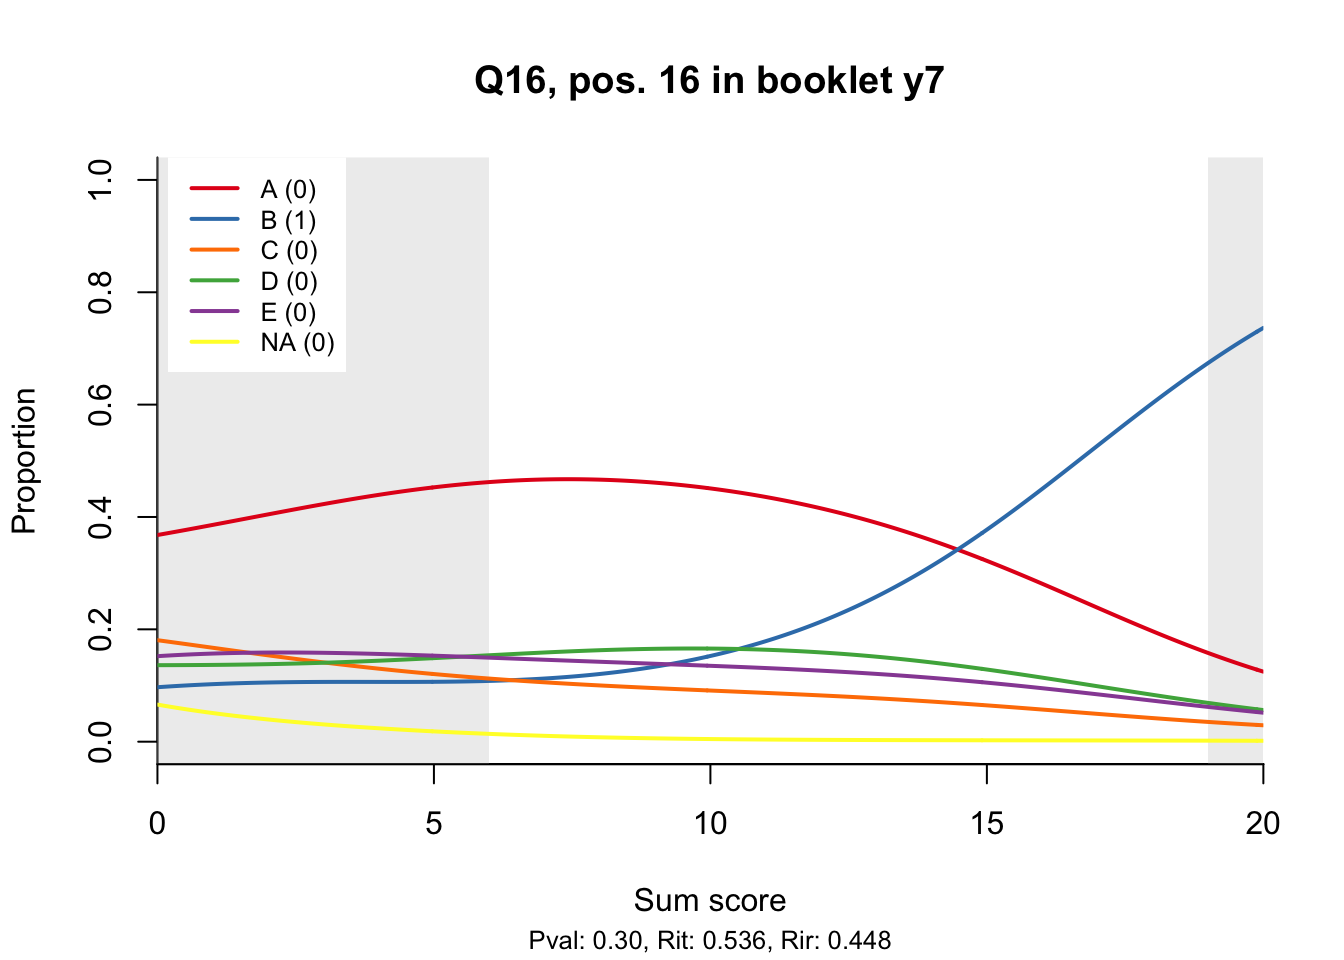
| y7 | Q16 | 0.30 | 0.46 | 1 | 0.30 | 0.54 | 0.45 | 3061 |
| y7 | Q17 | 0.55 | 0.50 | 1 | 0.55 | 0.41 | 0.30 | 3061 |
| y7 | Q18 | 0.62 | 0.48 | 1 | 0.62 | 0.35 | 0.23 | 3061 |
| y7 | Q19 | 0.26 | 0.44 | 1 | 0.26 | 0.56 | 0.48 | 3061 |
| y7 | Q2 | 0.92 | 0.27 | 1 | 0.92 | 0.37 | 0.31 | 3061 |
| y7 | Q20 | 0.55 | 0.50 | 1 | 0.55 | 0.33 | 0.21 | 3061 |
| y7 | Q3 | 0.66 | 0.47 | 1 | 0.66 | 0.50 | 0.41 | 3061 |
| y7 | Q4 | 0.93 | 0.25 | 1 | 0.93 | 0.34 | 0.29 | 3061 |
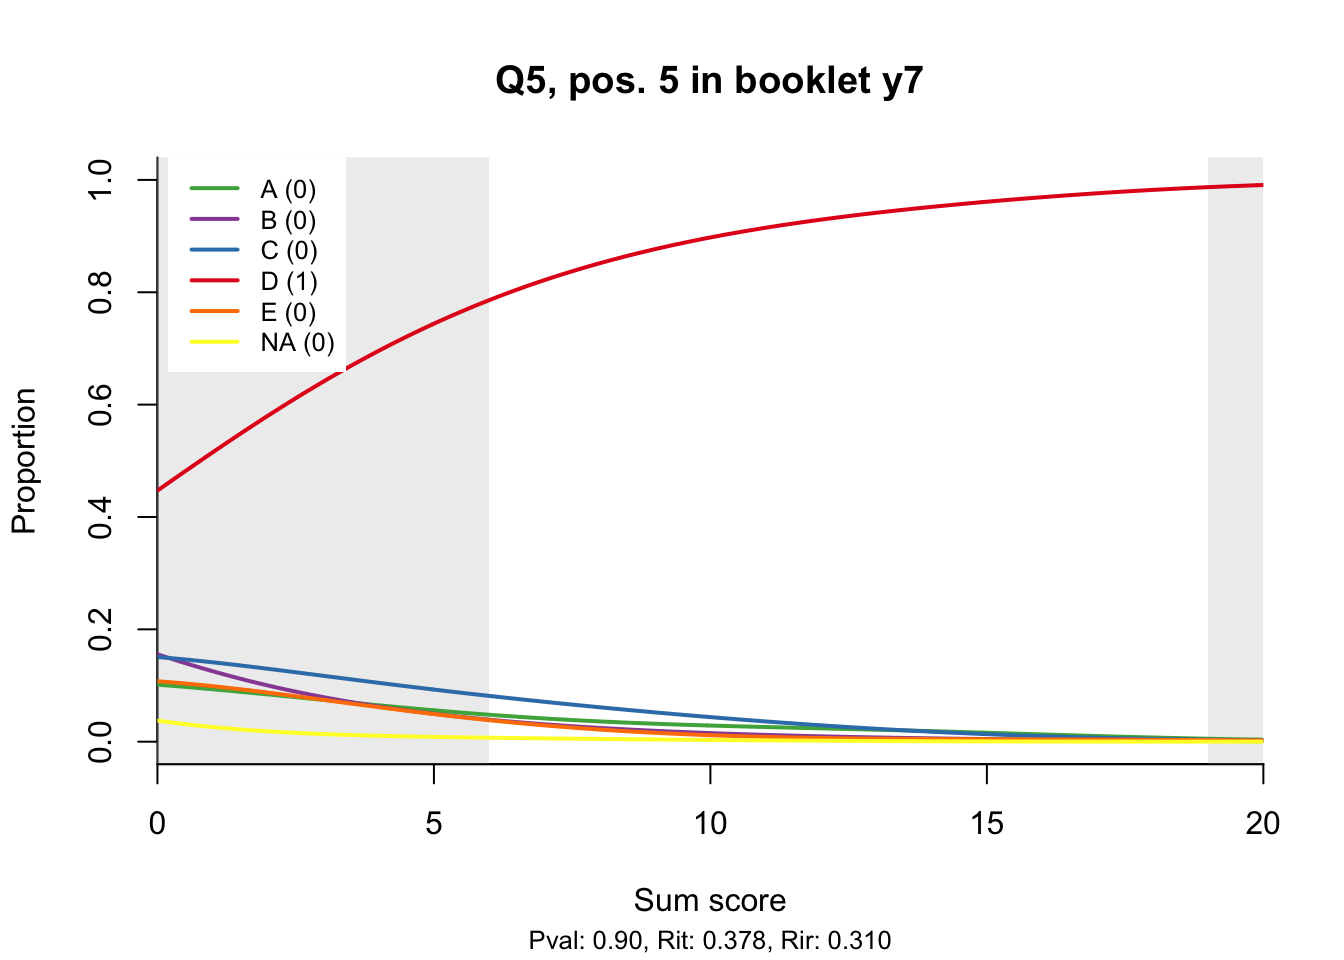
| y7 | Q5 | 0.90 | 0.31 | 1 | 0.90 | 0.38 | 0.31 | 3061 |
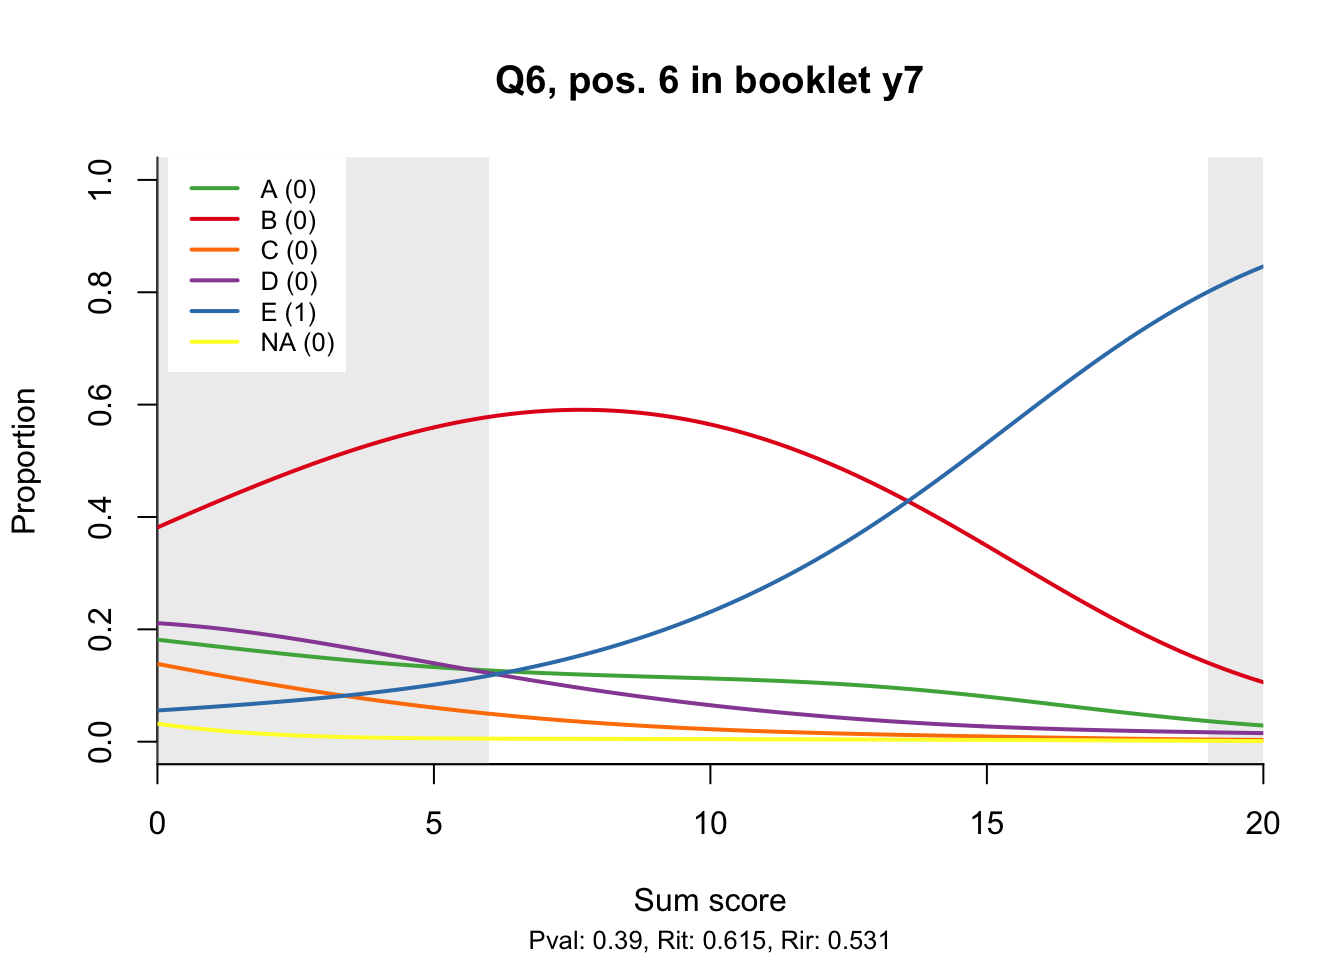
| y7 | Q6 | 0.39 | 0.49 | 1 | 0.39 | 0.61 | 0.53 | 3061 |
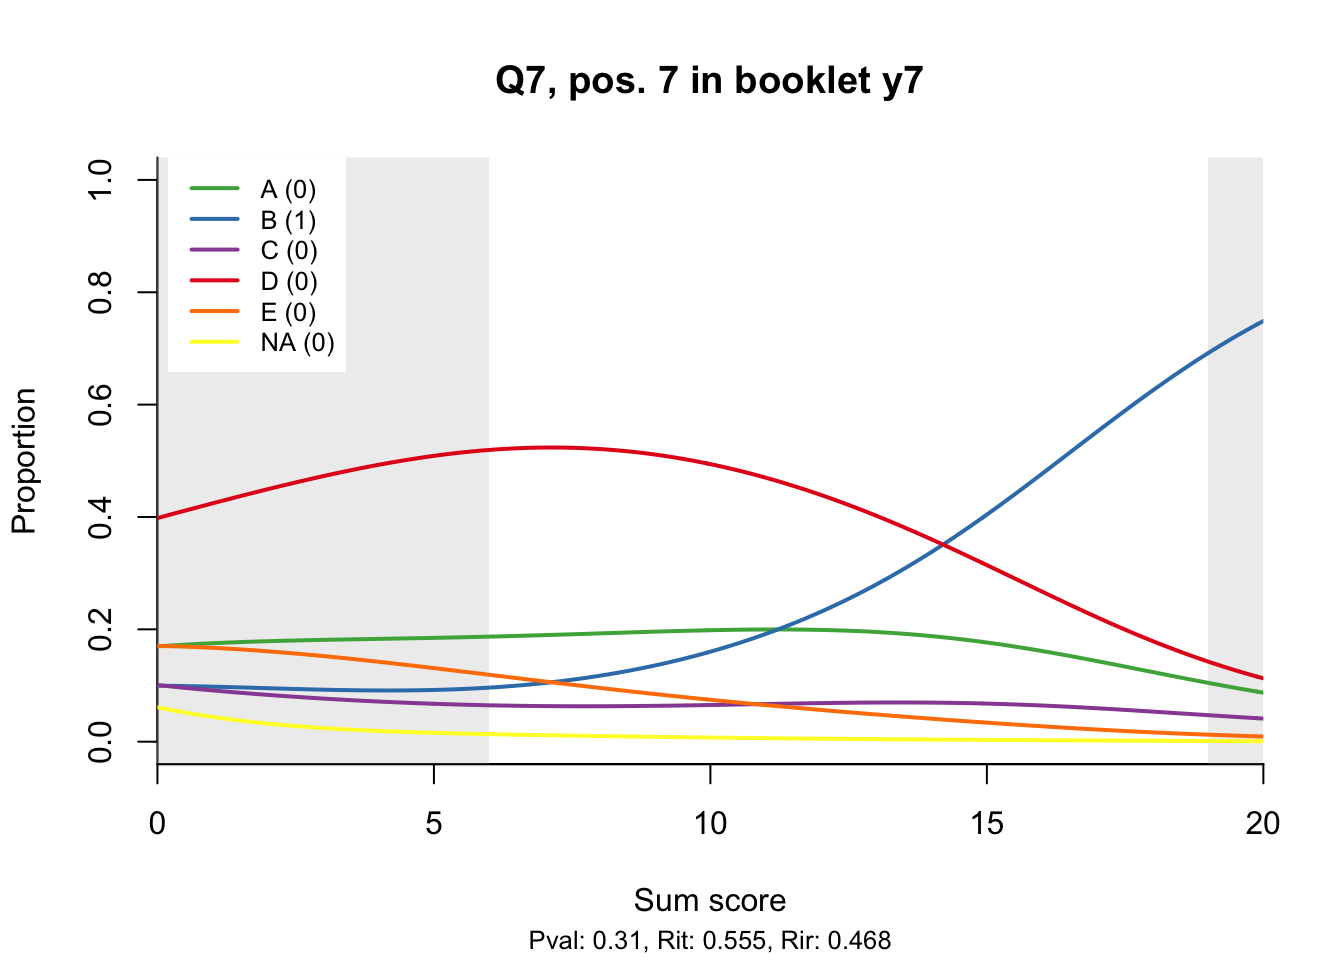
| y7 | Q7 | 0.31 | 0.46 | 1 | 0.31 | 0.56 | 0.47 | 3061 |
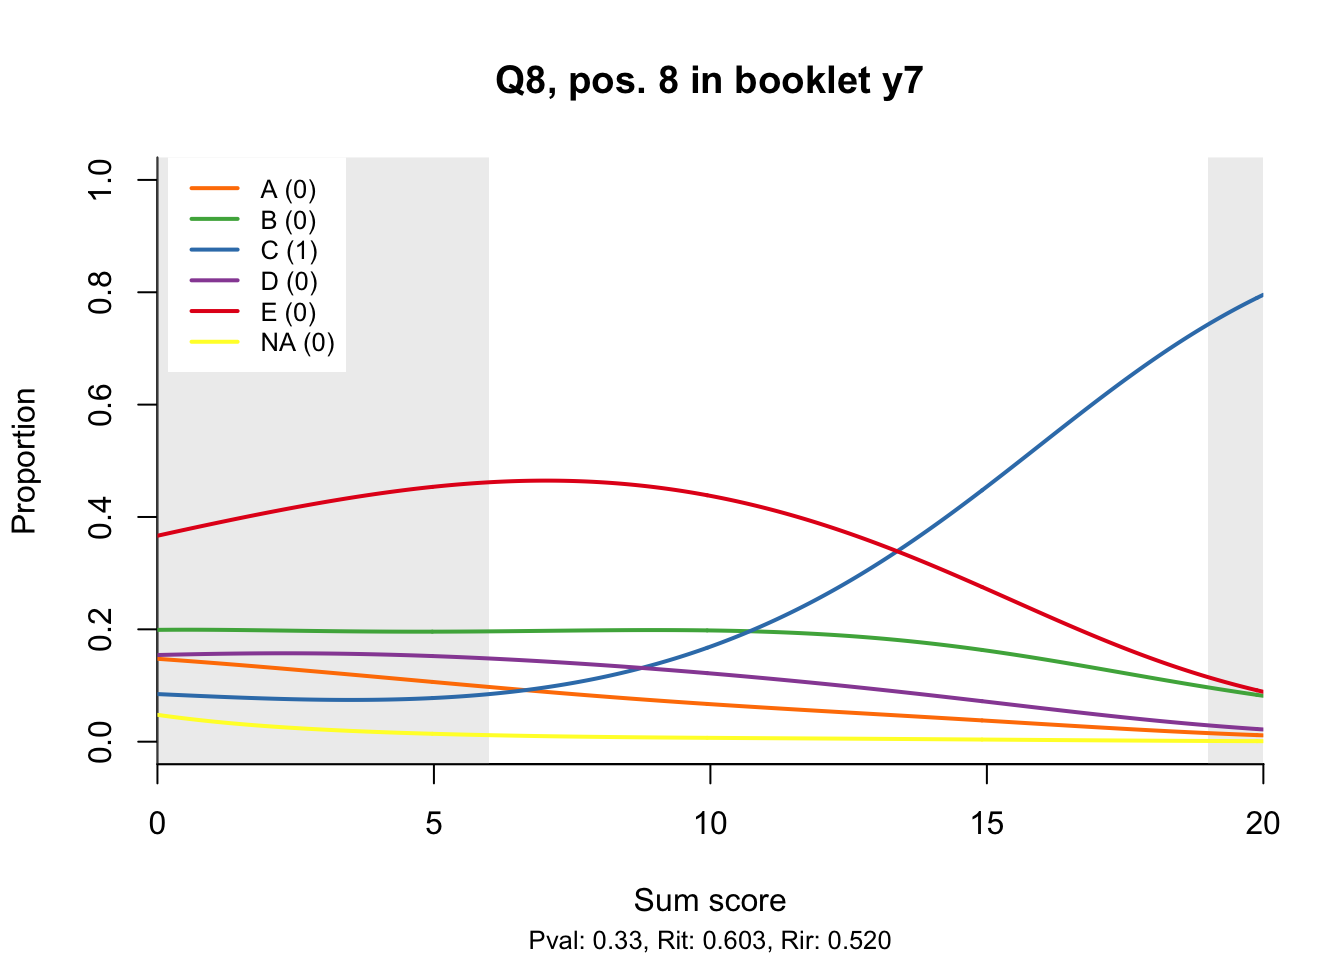
| y7 | Q8 | 0.33 | 0.47 | 1 | 0.33 | 0.60 | 0.52 | 3061 |
| y7 | Q9 | 0.59 | 0.49 | 1 | 0.59 | 0.61 | 0.52 | 3061 |
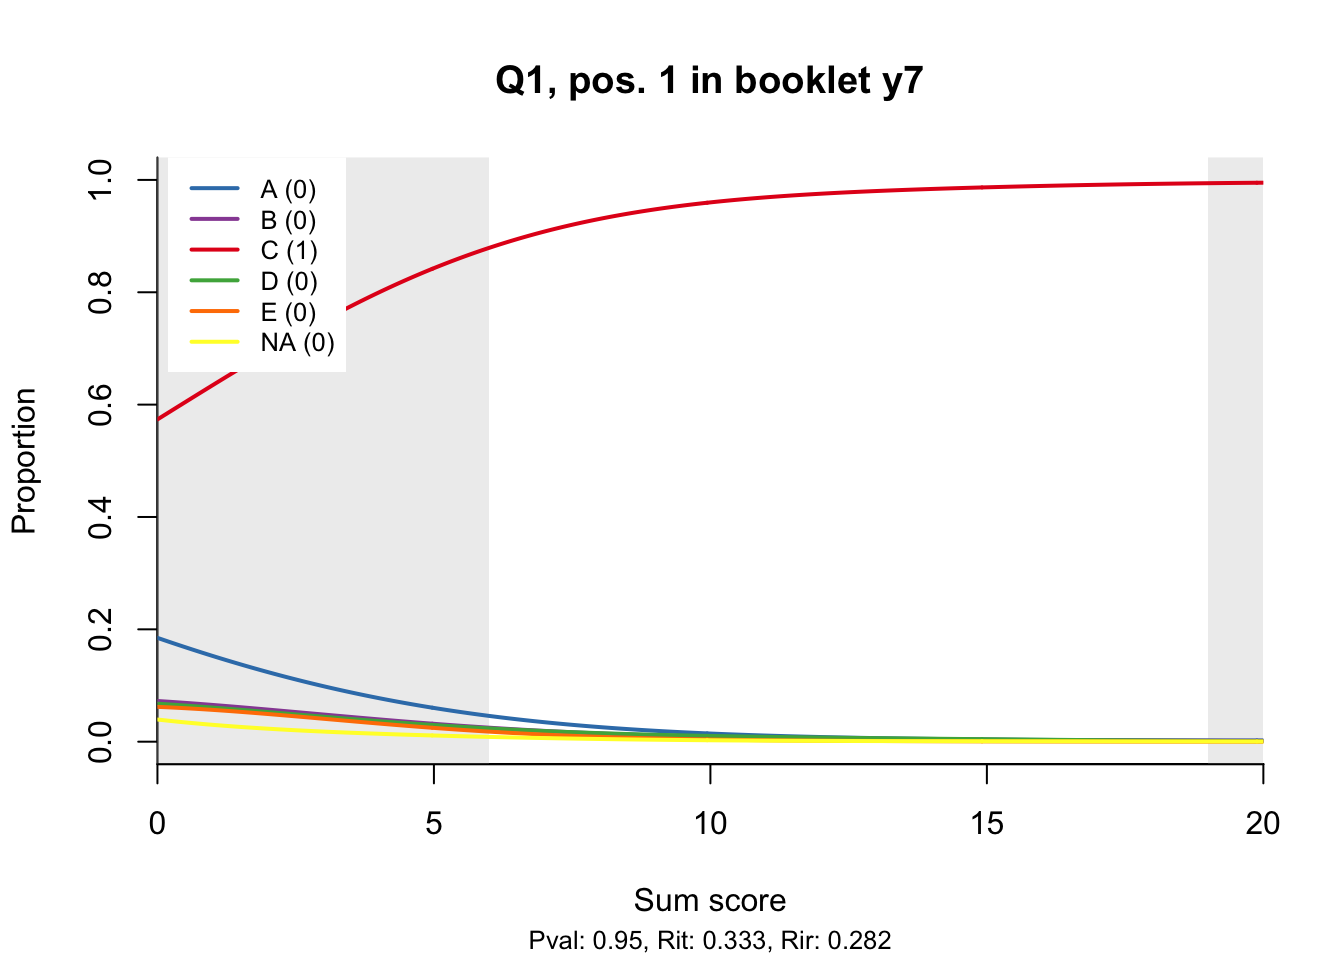
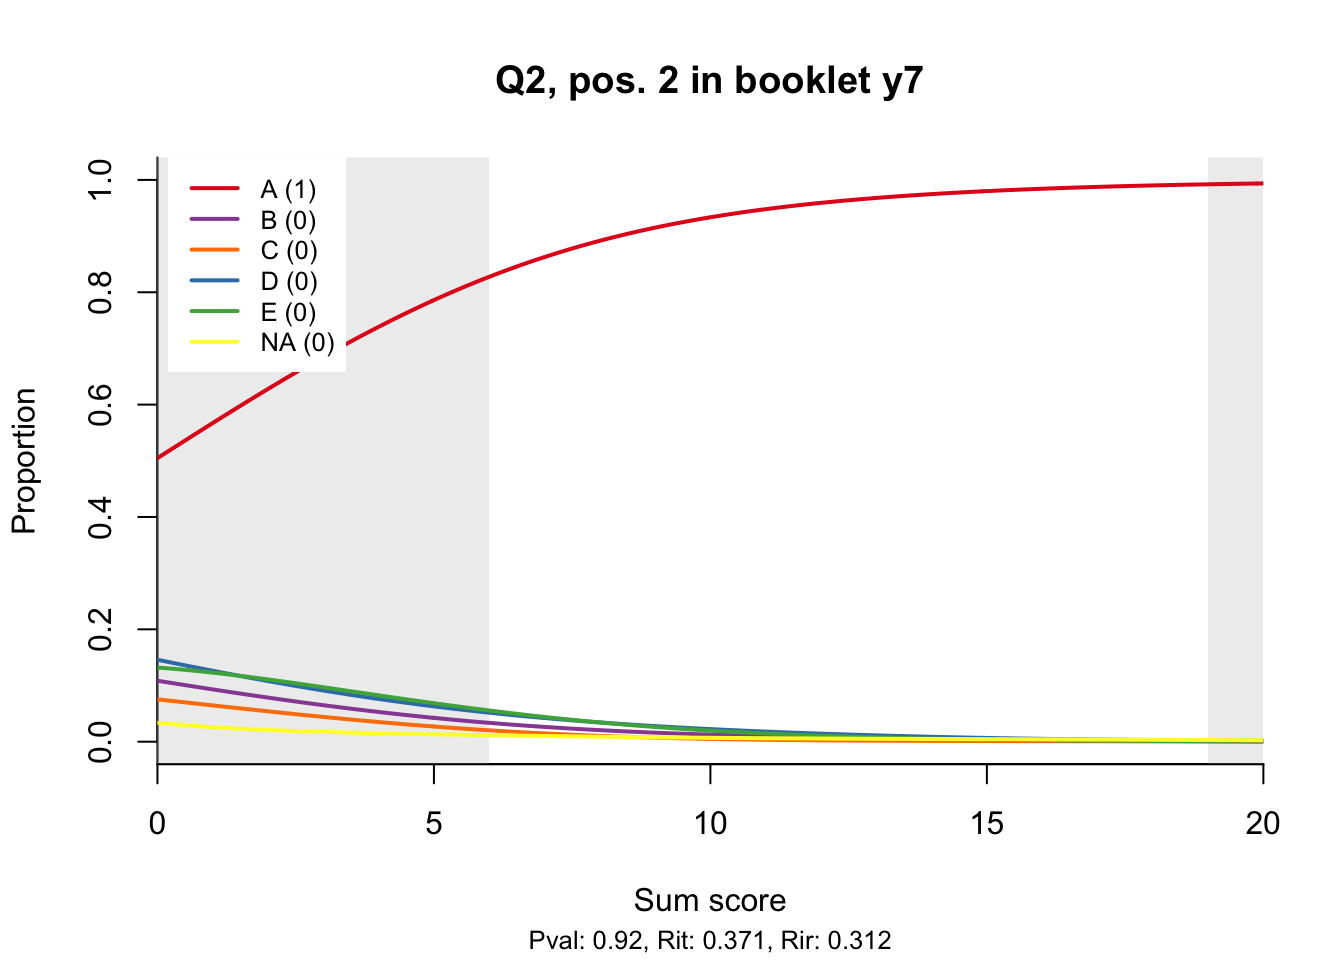
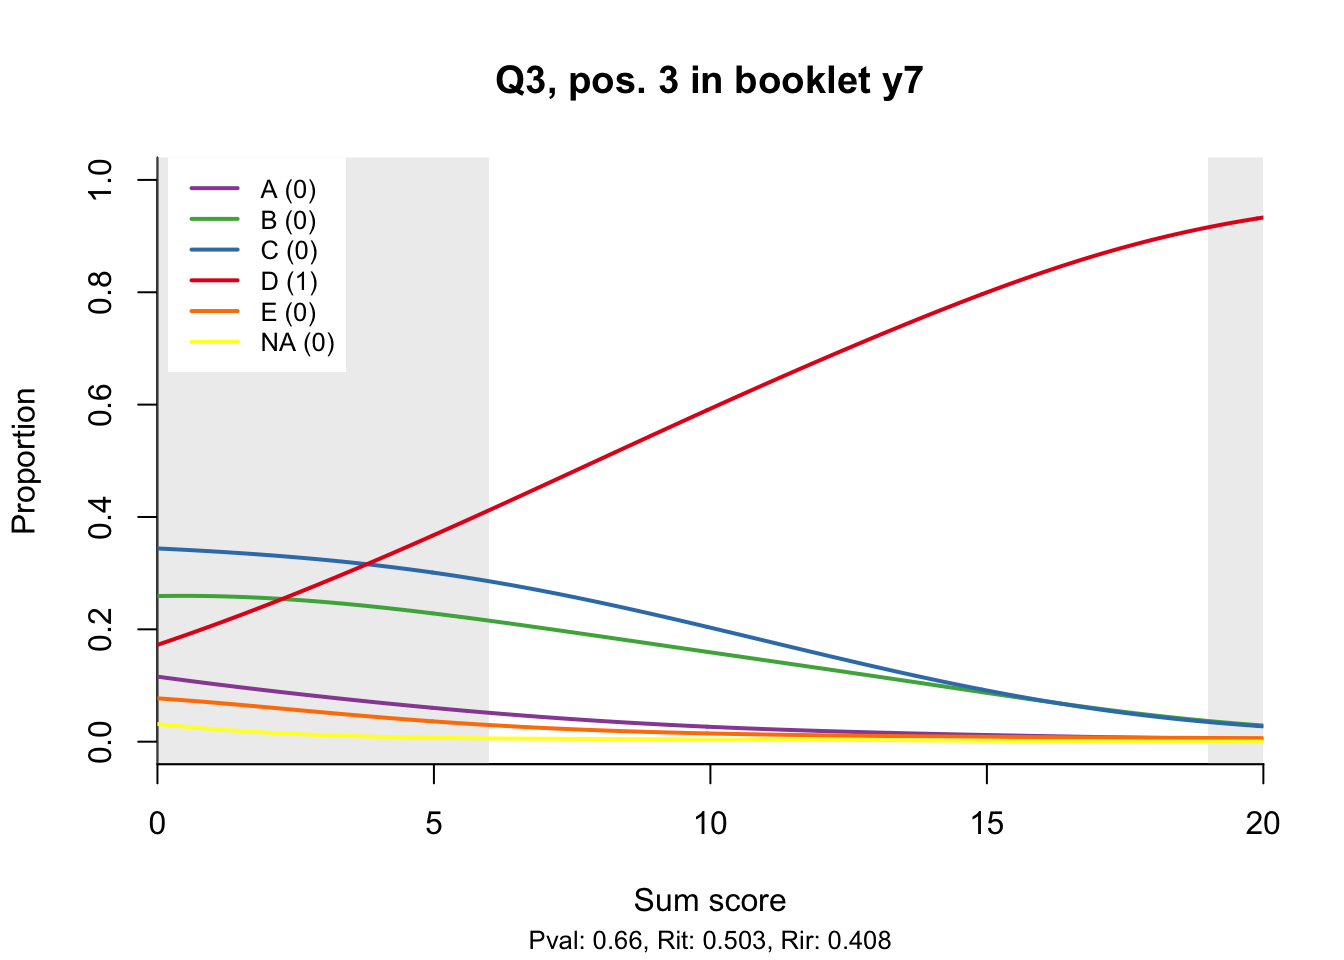
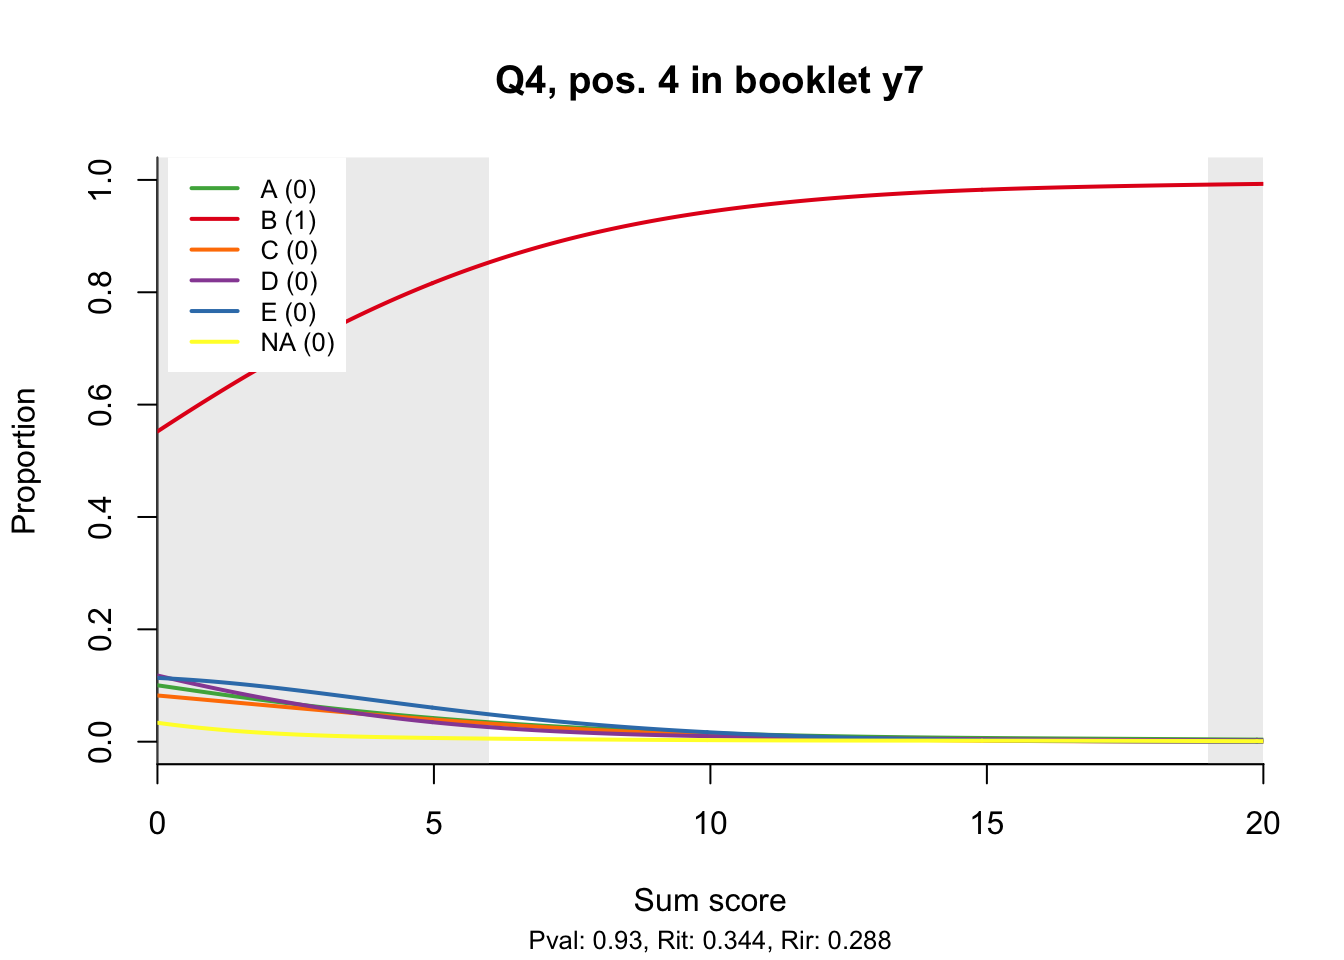
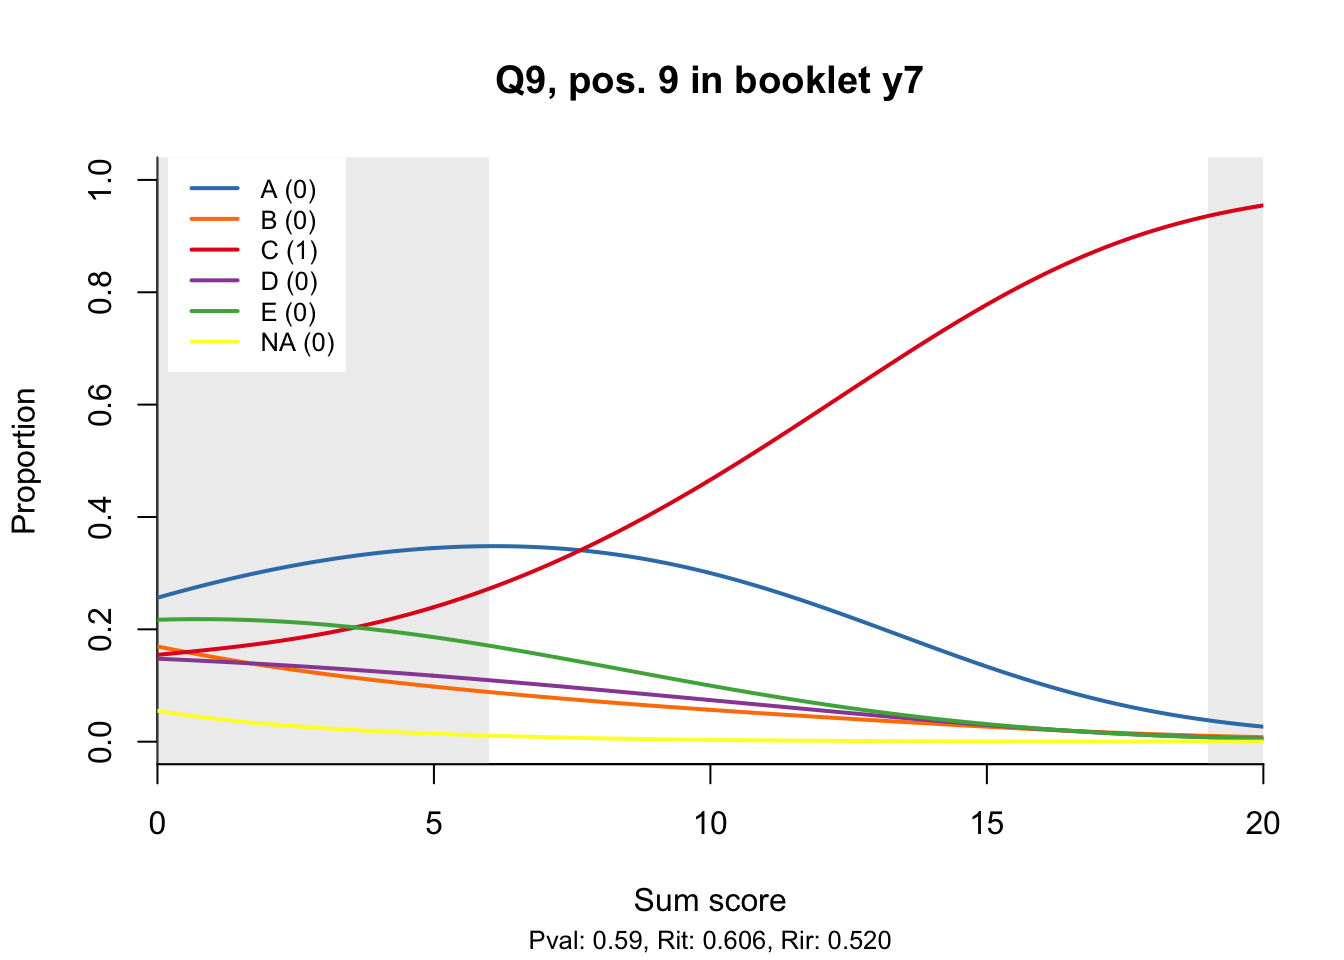
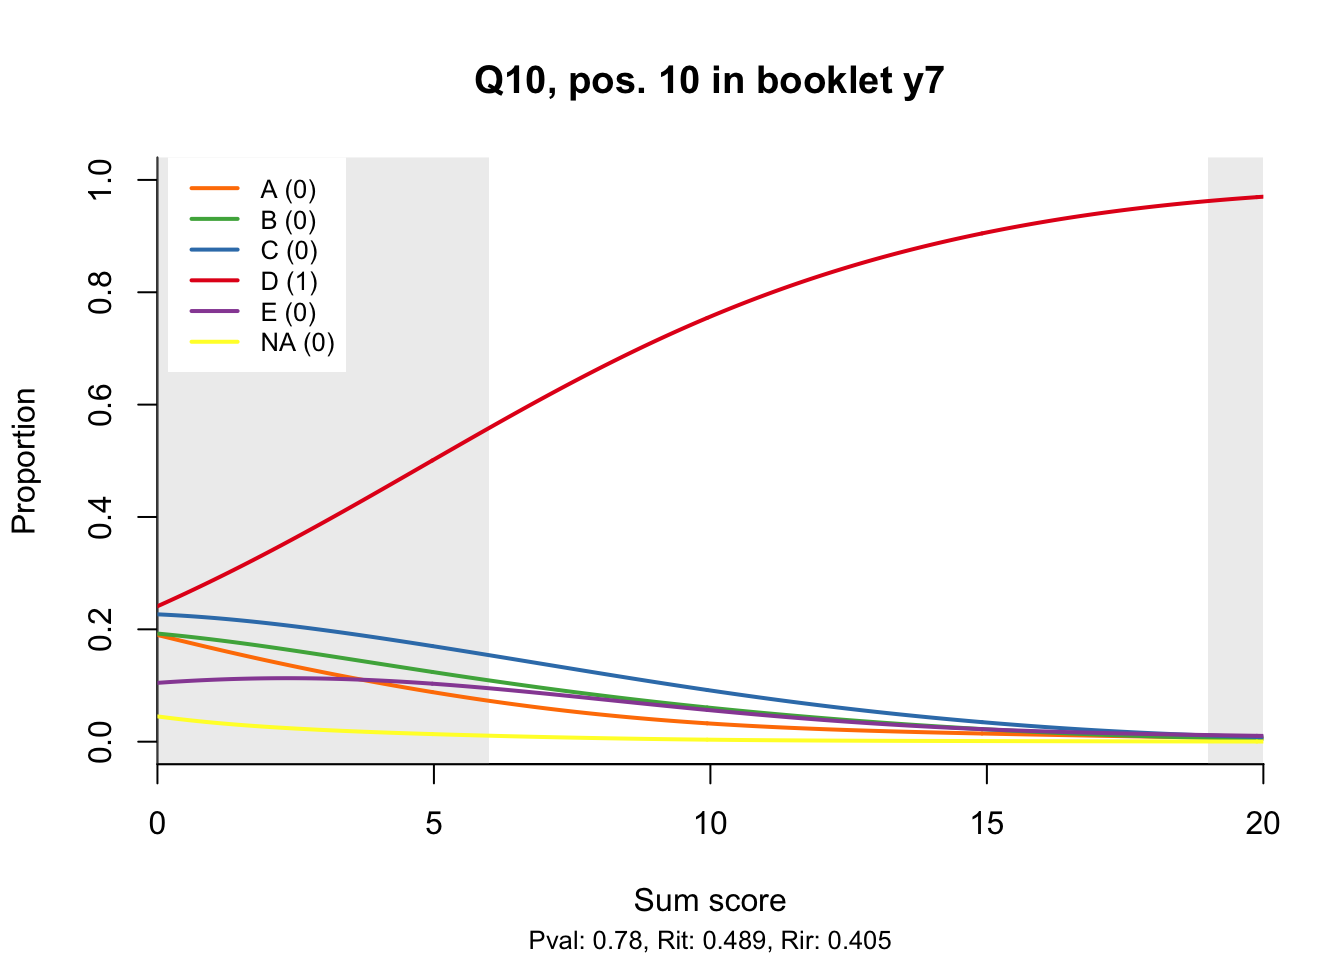
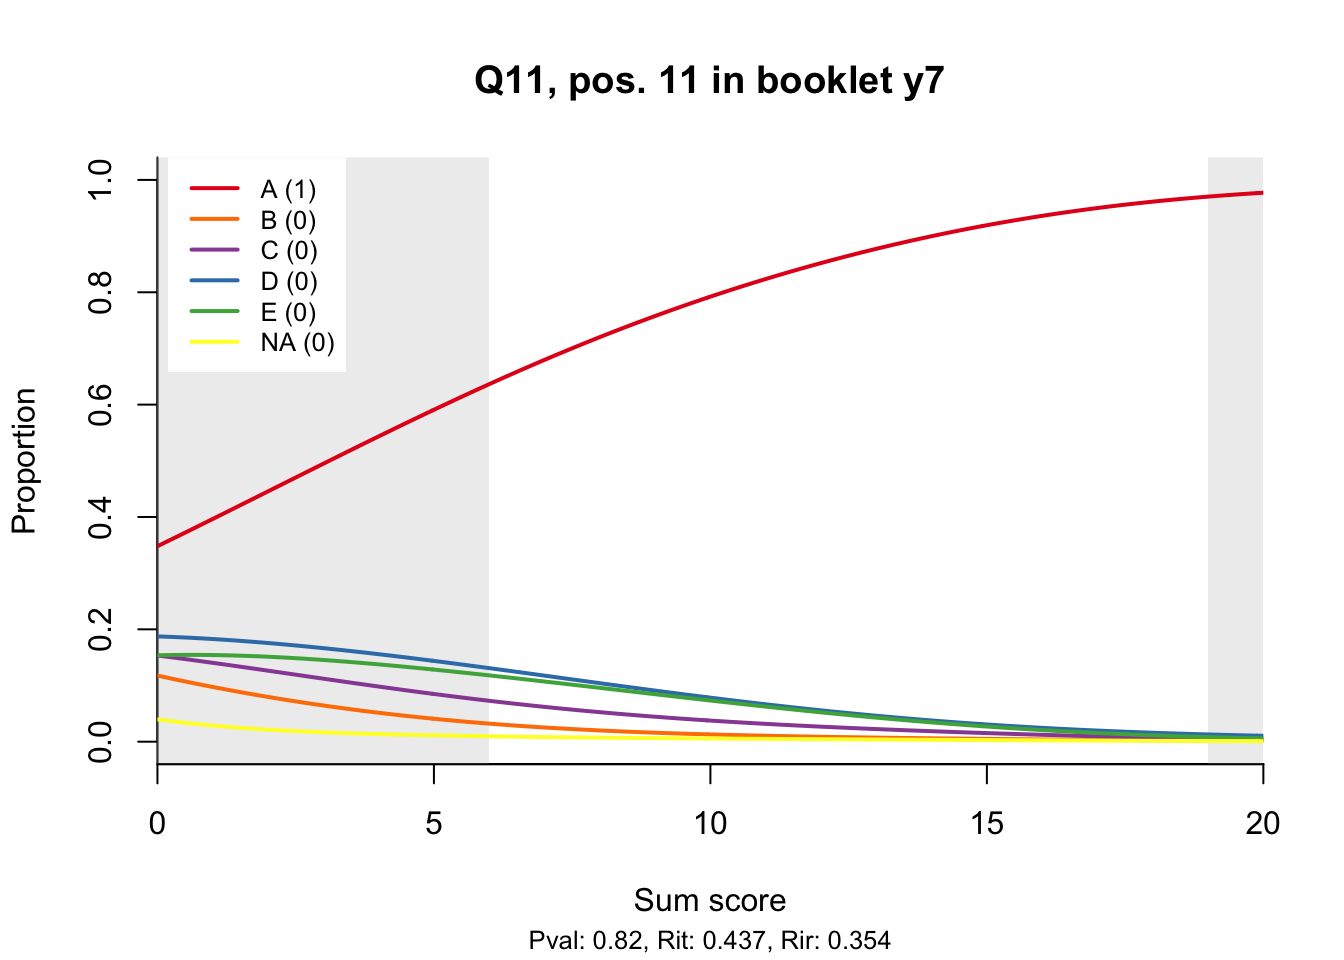
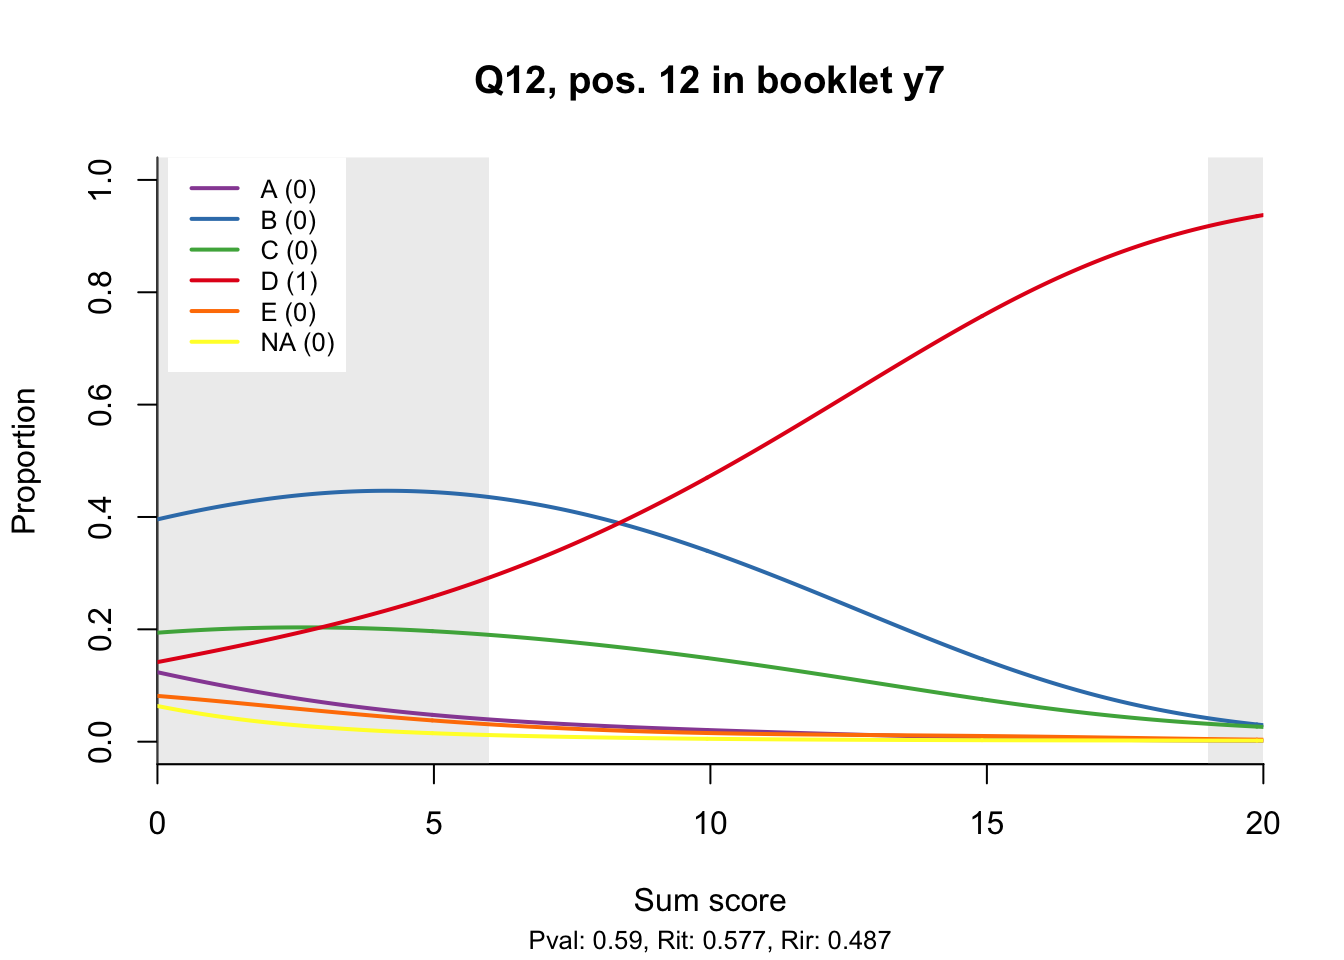
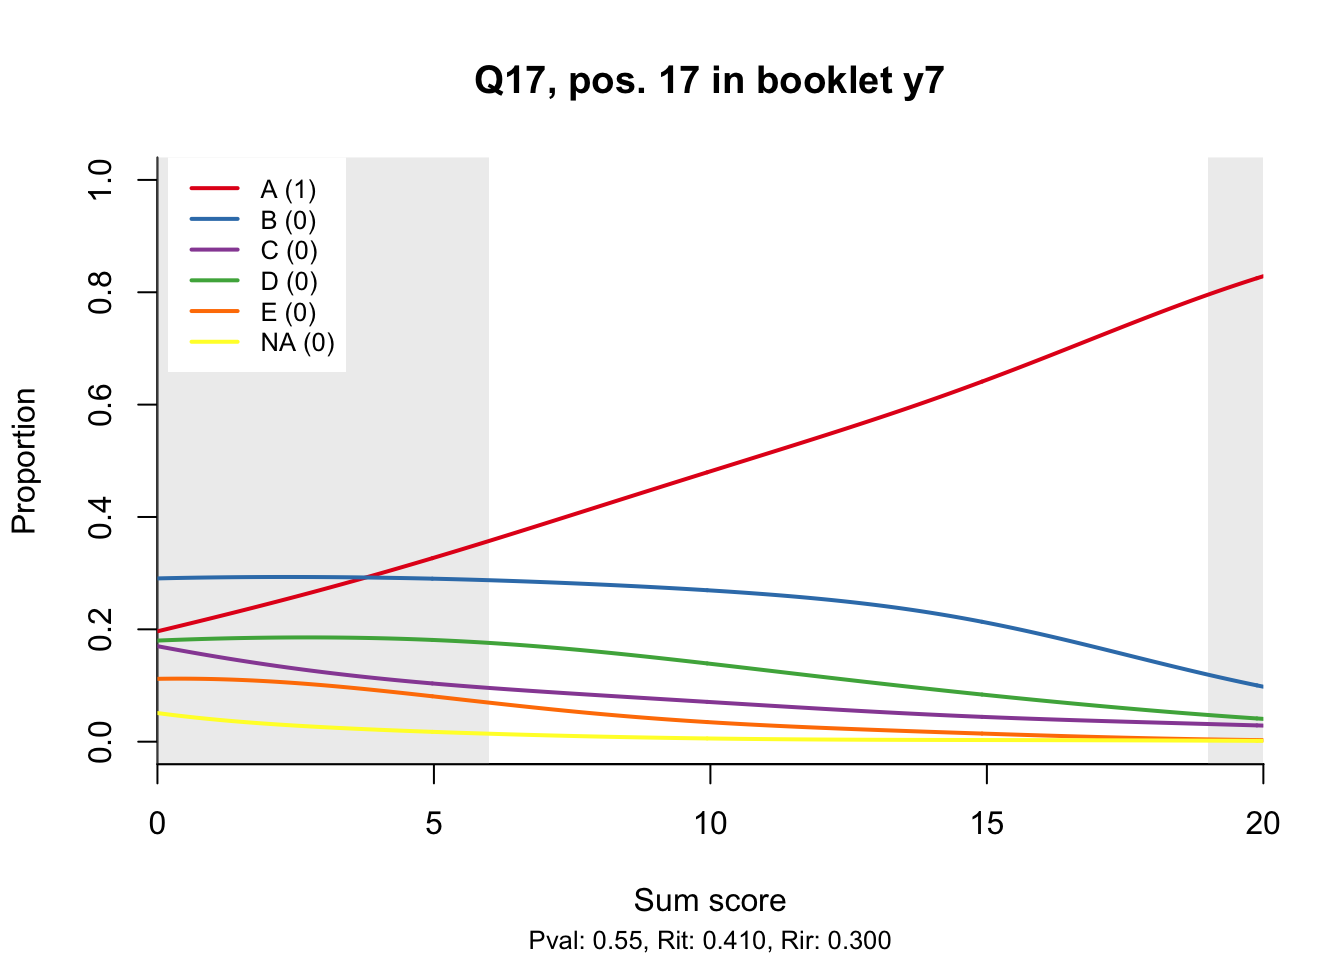
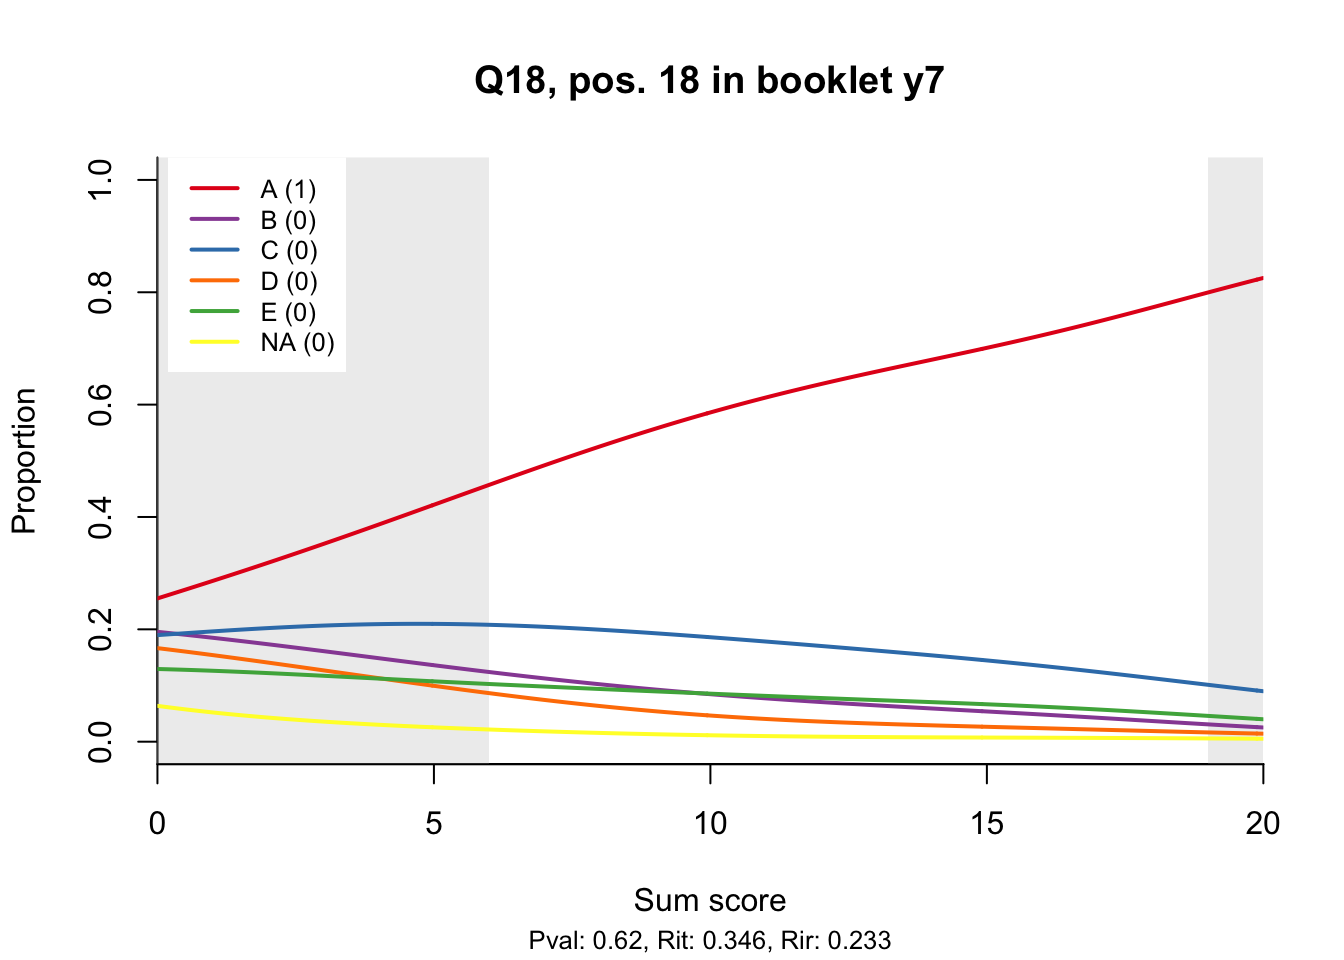
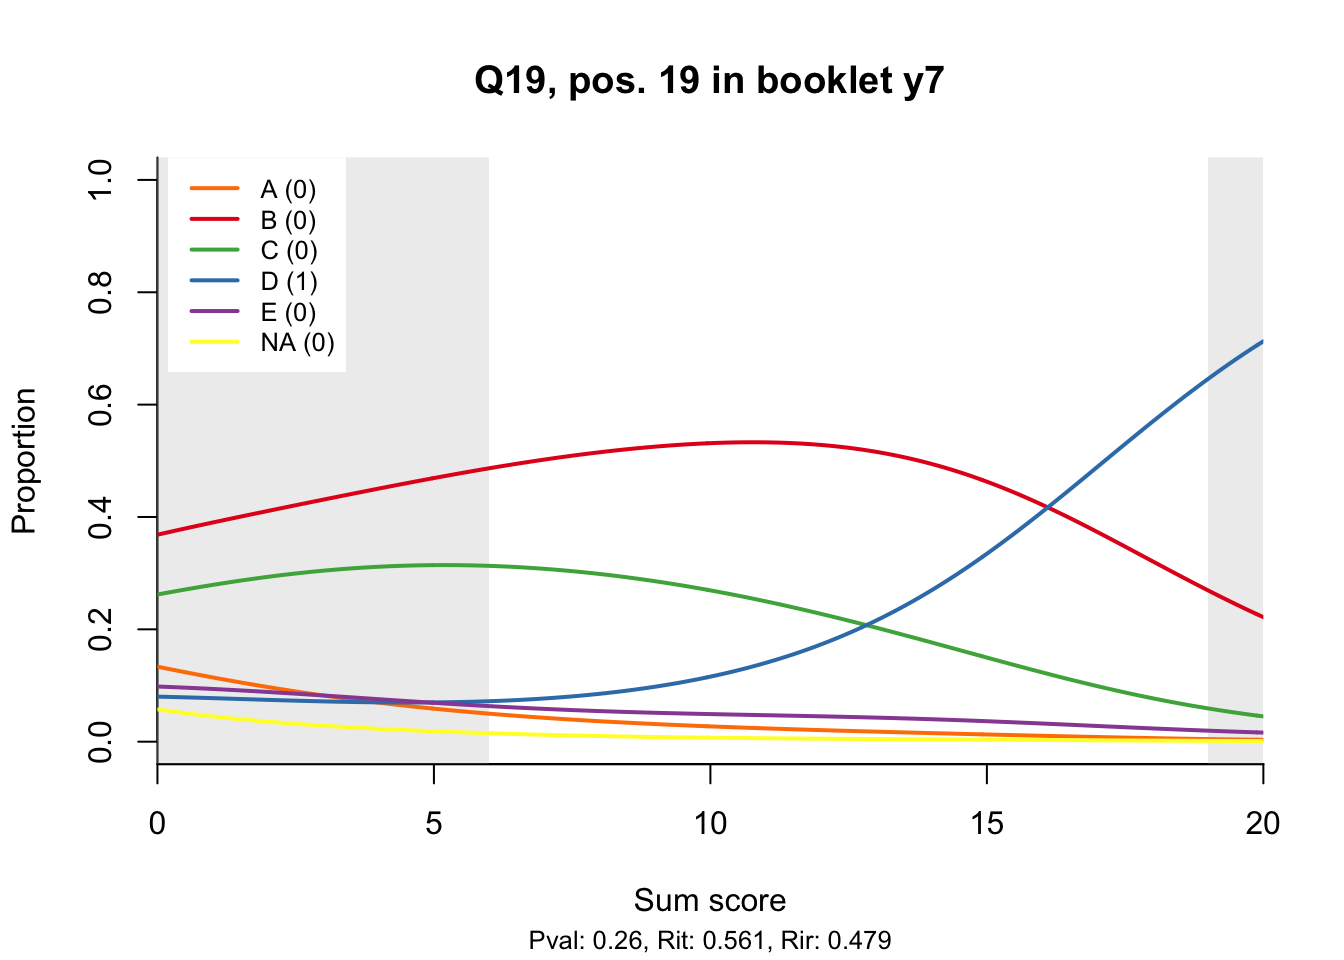
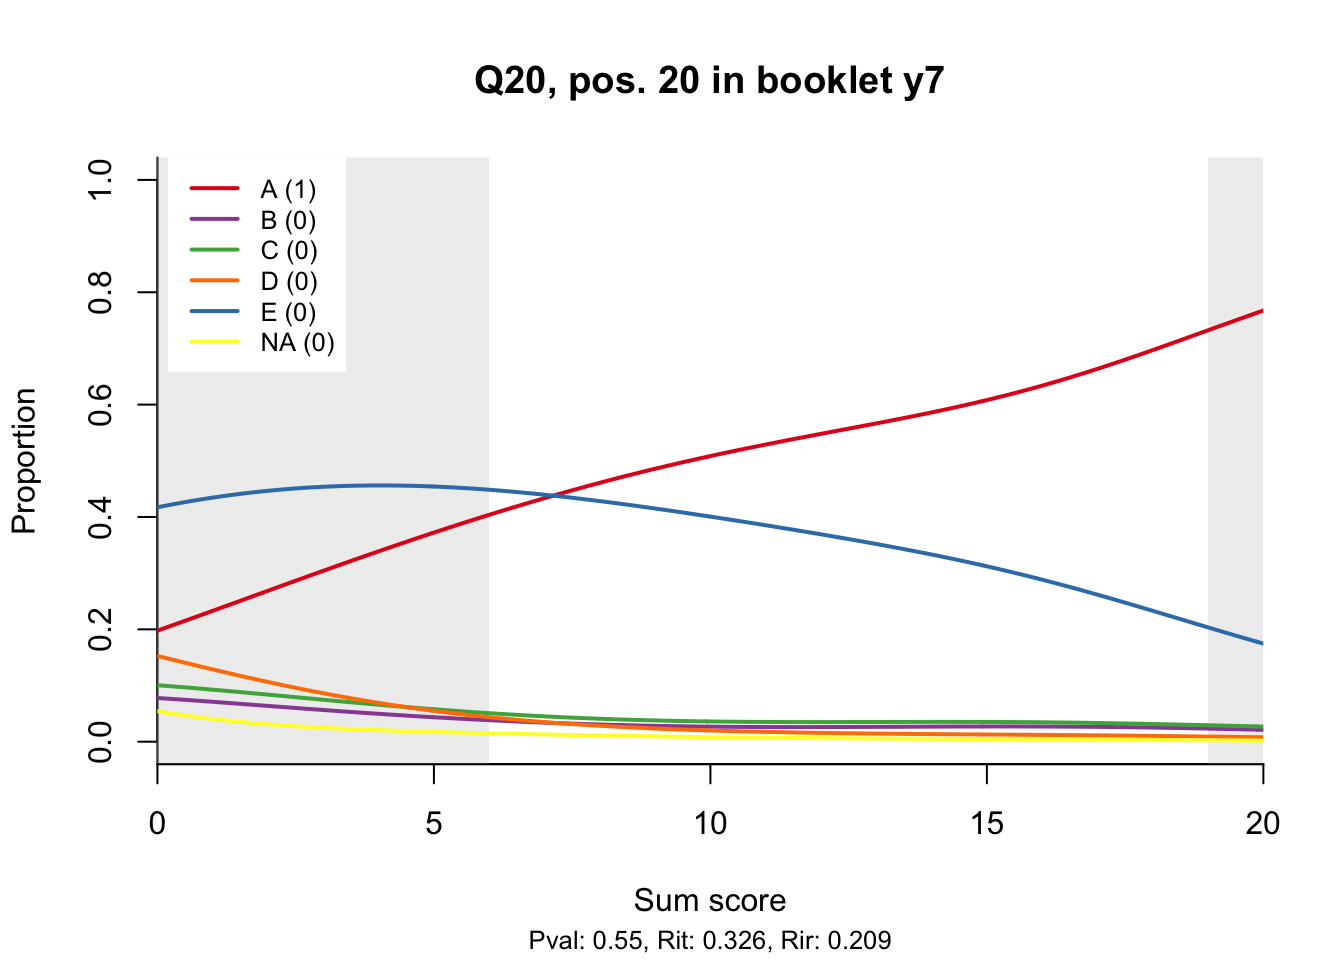
10.2 Distractor plots
Distractor plots provide visual information at response level. This is a non-parametric regression of the probability of each response (including non-response) on the total score, particularly useful to detect issues with multiple choice items due to wrong keys or, simply, sub-optimal item writing.
# Look at distractor plots for all items
n_items <- nrow(keys)
for(i in 1:n_items){
  distractor_plot(db, keys$item_id[i])
}
10.3 Analysis questions
- Does the slope of the correct answer always rise from left to right?
- Does the curve for the correct answer always rise above those for the incorrect answers?
- What does the steepness of the slope for the correct answer tell you about an item?
- Change the key so that one of the items is incorrectly marked. What do you see in the distractor analysis?
- What is the role of the curtains (the shaded areas in the plots)? Are there any items where they are particularly helpful?
- How many distractors generally seem to be useful?
- What would you typically expect the probability of guessing the correct answer to be for a MC item with 5 choices? If you look at the point at which the distractors cross the y-axis where sum score = 0, what do you learn about the actual probabilities?
- Can you make any recommendations for improvement based on the distractor analysis?
close_project(db)